ADC visibility / SecOps signal / terminal first

See the traffic.
Find the signal.

IPSONIC-ADCTOP turns live Nginx access logs into a colorful, keyboard-driven operations console. Follow throughput, investigate errors, identify noisy clients, and spot suspicious patterns — without a monitoring stack.

Python 3 stdlib only12 dashboards60 themesSSH friendlyOn-prem firstNo database
Neon unicorn with a golden horn, white coat, and flowing cyan, violet and pink mane and tail
PACKET EYES. OPERATOR INSTINCT.
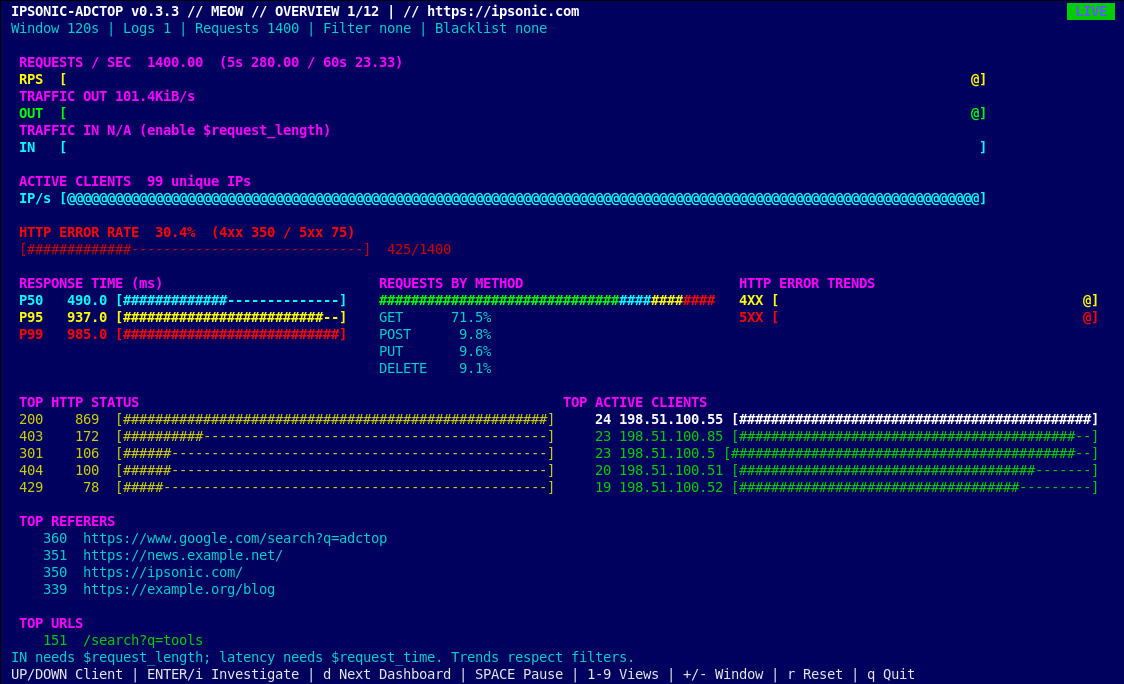
Real IPSONIC-ADCTOP overview dashboard captured from the curses terminal using synthetic Nginx access logs
Actual IPSONIC-ADCTOP v0.3.4 terminal rendering in the MEOW theme, captured with synthetic Nginx requests. Click to inspect the full-size PNG.
Why use IPSONIC-ADCTOP?

When the reverse proxy is the first place you look.

Nginx access logs are already recording what your edge is doing. ADCTOP turns that raw stream into an immediate operational picture: what changed, which URLs or clients dominate, whether failures are increasing, and where response time is being lost. No log shipping, cloud account, or monitoring infrastructure is needed to start asking useful questions.

ADC / REVERSE PROXY OPERATORS

Know your edge

Spot bandwidth spikes, unusually active IPs, changes in request mix, and the URLs consuming capacity. Move from a wall of access-log lines to a prioritized investigation.

SECOPS / INCIDENT RESPONDERS

Find the suspicious pattern

Correlate 401/403/404/429 activity, scanning paths, user agents, and noisy clients during a live incident. Use the results as leads for deeper analysis, not as automatic threat verdicts.

SRE / PLATFORM / WEB TEAMS

Validate changes faster

Watch 5xx rates, redirects, API traffic and latency during deployments or troubleshooting. Check whether a fix improves behavior before opening a heavier analytics stack.

Designed for: Linux administrators, ADC and Nginx operators, on-call engineers, SecOps teams, and developers supporting their services. Outcome: faster first diagnosis, less operational friction, and more useful signal from logs you already own.
01 / Operational philosophy

Built for the shell.
Useful in the incident.

You already have Nginx logs. ADCTOP makes them actionable without shipping them elsewhere. Ideal for reverse proxies, load balancers, ADC nodes, web gateways, jump hosts, and operators who prefer a fast SSH session over another browser tab.

NO STACK REQUIRED

Minimal dependencies

One Python 3 script. Standard-library parsing, terminal rendering, and keyboard input. No pip packages, agents, collectors, message queues, or database.

LIVE OPERATIONS

Sliding-window visibility

Track requests per second, traffic in and out, HTTP status classes, clients, methods, referers, user agents, and response times.

SECOPS CONTEXT

Investigate, don't guess

Review unusual clients, error-heavy URLs, suspicious paths, and crawler-like user agents. Heuristics are clues, not attack verdicts.

REMOTE FRIENDLY

Logs over SSH

Stream access logs from another machine over a plain SSH pipe. Use FD 3 for the log stream and /dev/tty for reliable keyboard control.

HUMAN-FIRST UI

Keyboard and color

Switch dashboards, investigate clients, apply filters, and cycle 60 retro and high-contrast themes — including wallboard and daylight styles.

LOCAL BY DESIGN

On-premise first

No SaaS account, outbound telemetry, or external API required. Operate close to the logs on Debian, Ubuntu, AlmaLinux, Rocky Linux, and similar Linux hosts.

Authentic terminal captures: all 21 images were captured directly from IPSONIC-ADCTOP v0.3.4 running in xterm (160 × 48 characters, MEOW theme) under Xvfb, using 1,400 synthetic Nginx access-log records. They are not AI-generated or reconstructed interfaces. Metrics are illustrative test data.

02 / Twelve focused views

One log stream. Twelve angles.

Start a dashboard directly from the command line, or press d to cycle through all dashboards, then return to the nine-page table mode. URL lists use full-width rows in the focused dashboards.

01 / OVERVIEW

Everything at a glance

RPS, bandwidth, unique clients, response-time percentiles, error trends, HTTP status distribution, top URLs, and referers.

02 / TRAFFIC

Where the bytes go

Incoming and outgoing traffic, throughput, request volume, busiest URLs, and high-volume clients.

03 / ERRORS

4xx and 5xx

HTTP error rates, status distribution, top failing URLs, and clients associated with error traffic.

04 / SUCCESS

2xx and 3xx traffic

Successful responses, redirects, commonly requested healthy URLs, clients, and methods.

05 / USER-AGENTS

Who claims to be calling

Top user-agent strings, associated requests, clients, URLs, and status behavior.

06 / REFERRERS

Where traffic starts

Referrer distribution, destination URLs, and clients. Optional grouping by referrer hostname.

07 / LATENCY

Find the slow path

P50, P95, and P99 response times, slow URLs, and clients with costly requests when request-time data is logged.

08 / CLIENTS

Find the loud neighbor

Most active IP addresses, request volume, bytes, and frequently requested URLs.

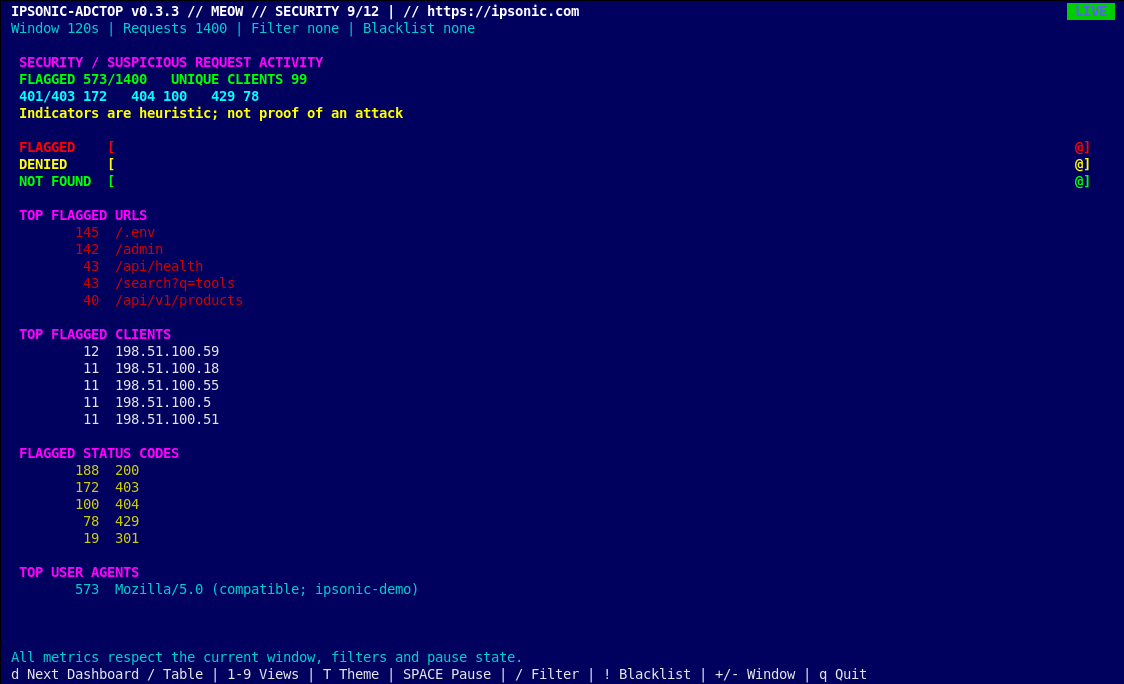
09 / SECURITY

Suspicious access patterns

401/403/404/429 responses, probe-like paths, suspicious URLs, and clients worthy of closer inspection.

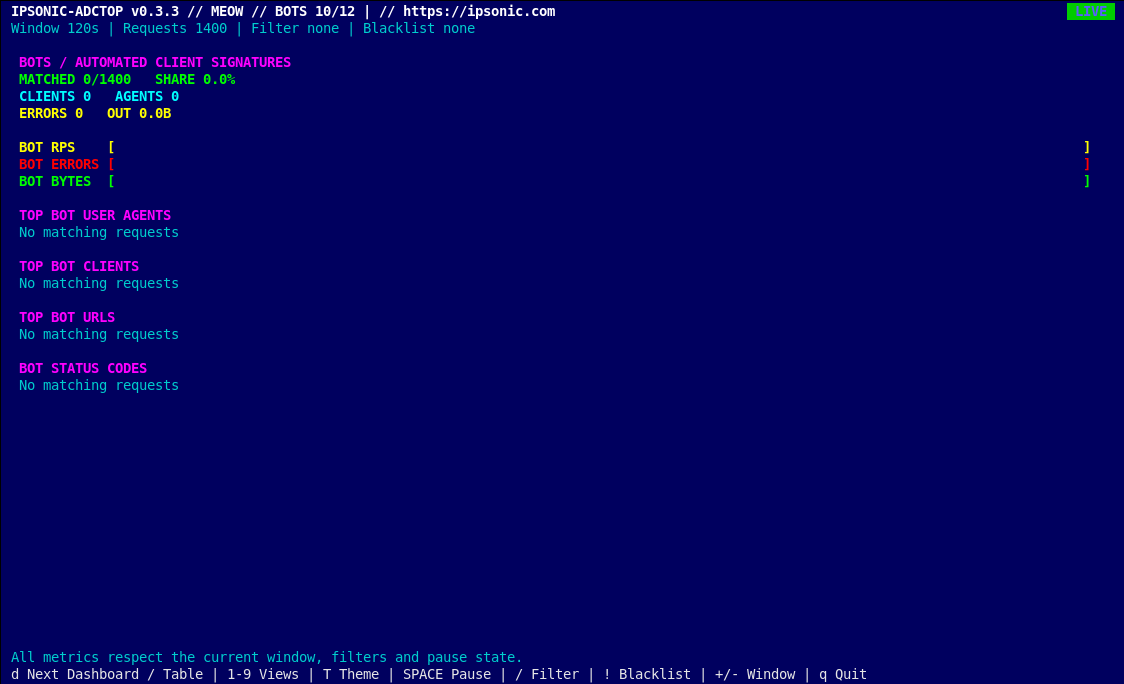
10 / BOTS

Crawlers and automation

Bot-like user-agent patterns, associated requests, target URLs, and client activity.

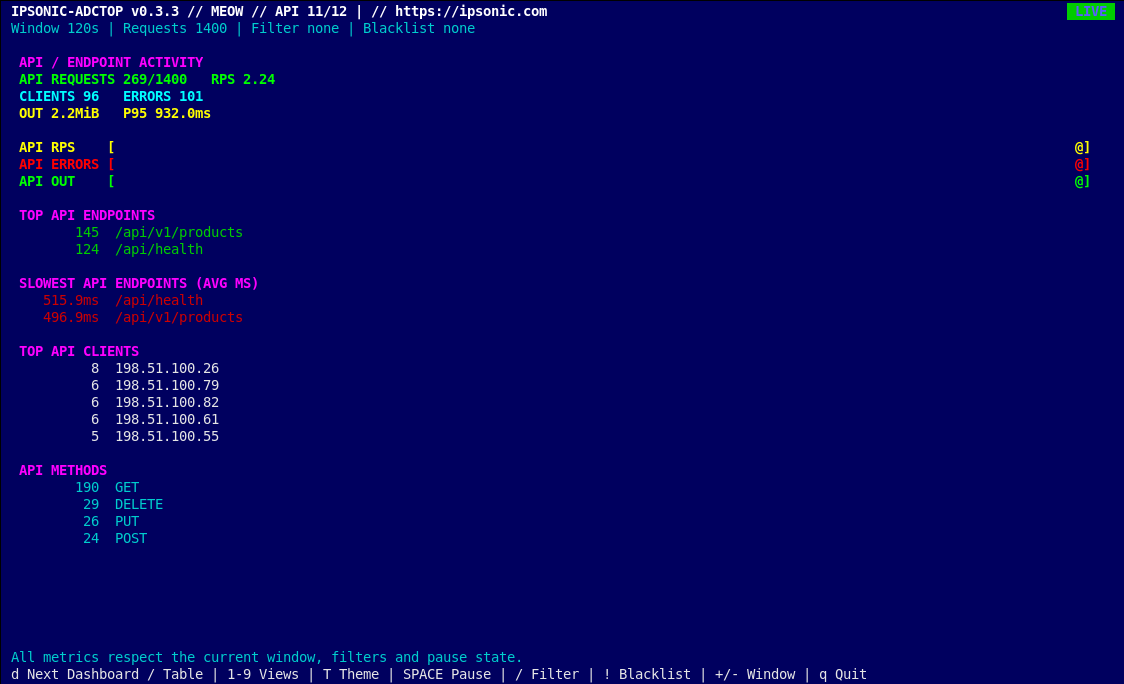
11 / API

Endpoint behavior

API paths, methods, HTTP errors, request rates, and endpoint response times.

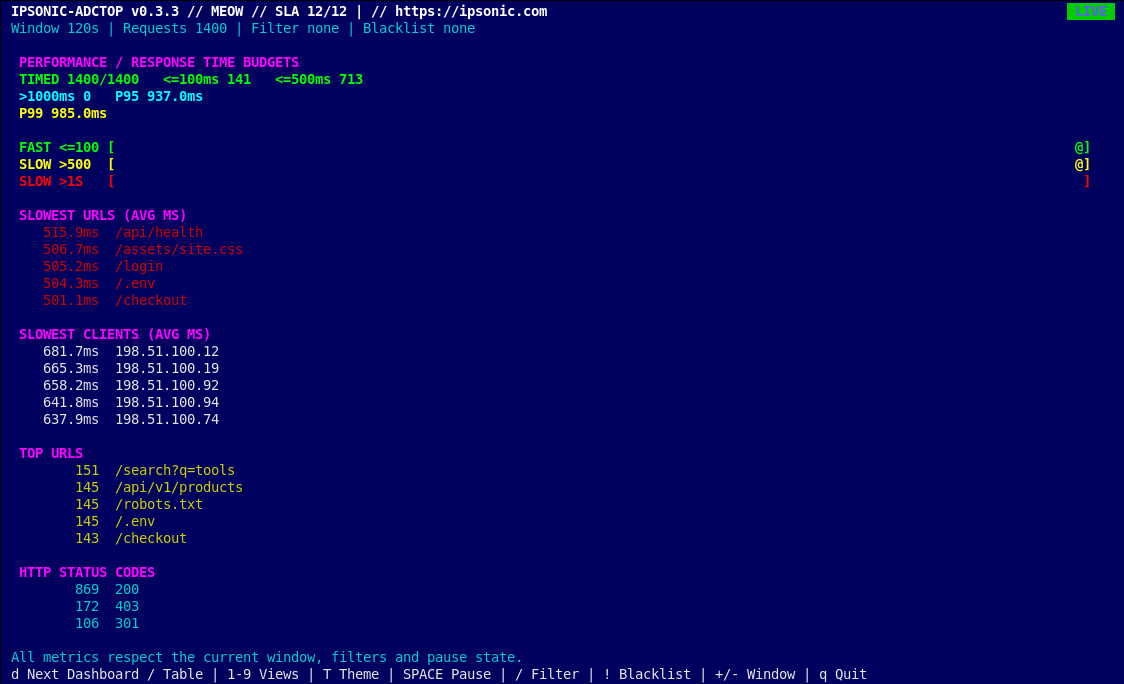
12 / SLA

Response-time health

Latency buckets, slow requests, P95/P99 behavior, and URLs that may be hurting user experience.

The Security and Bots views use access-log heuristics. They are not a WAF, IDS, bot-verification service, or proof of malicious intent.
03 / Real terminal screenshots

What operators actually see.

Every image below was captured by running the actual IPSONIC-ADCTOP v0.3.4 Python/curses application in a 160 × 48 terminal with the meow theme and synthetic Nginx combined-log data. These are not mockups or AI-generated interfaces. Select any image for its original PNG.

12 live dashboards

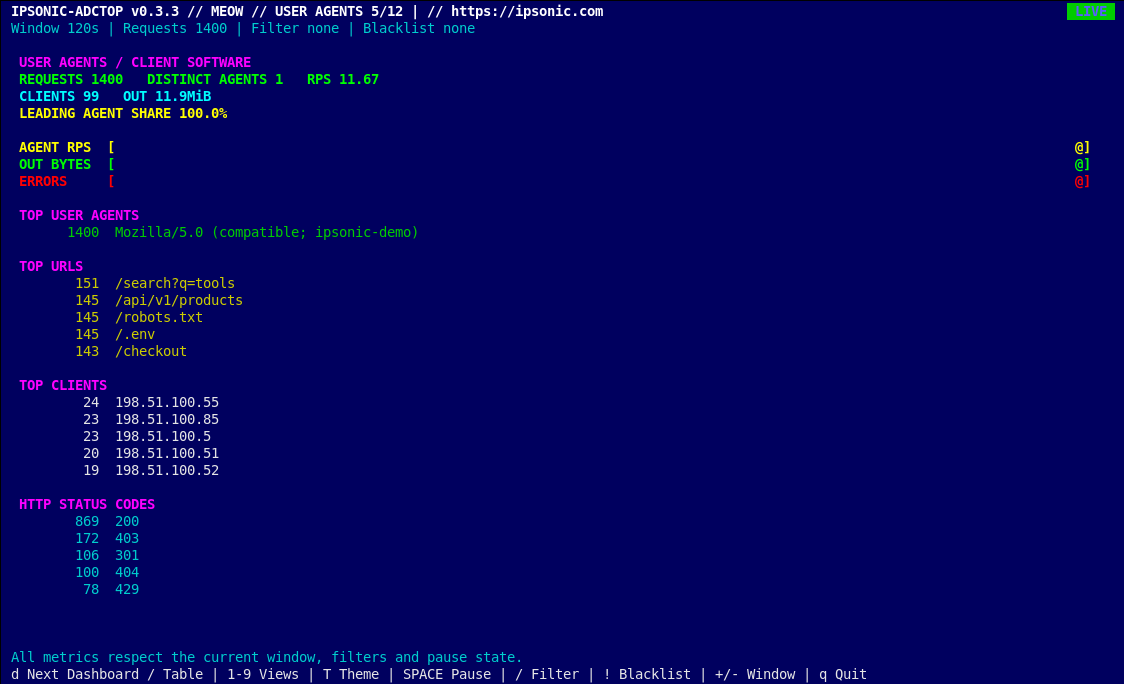
DASHBOARD 01 / 12 · --dashboard overview

Operations overview

A single-pane summary of request rates, traffic in/out, unique clients, HTTP status distribution, response-time percentiles, and busiest URLs. Start here when a reverse proxy behaves unexpectedly.

Actual colored curses screenshot of the Operations overview dashboard
Actual terminal capture · MEOW theme · synthetic data
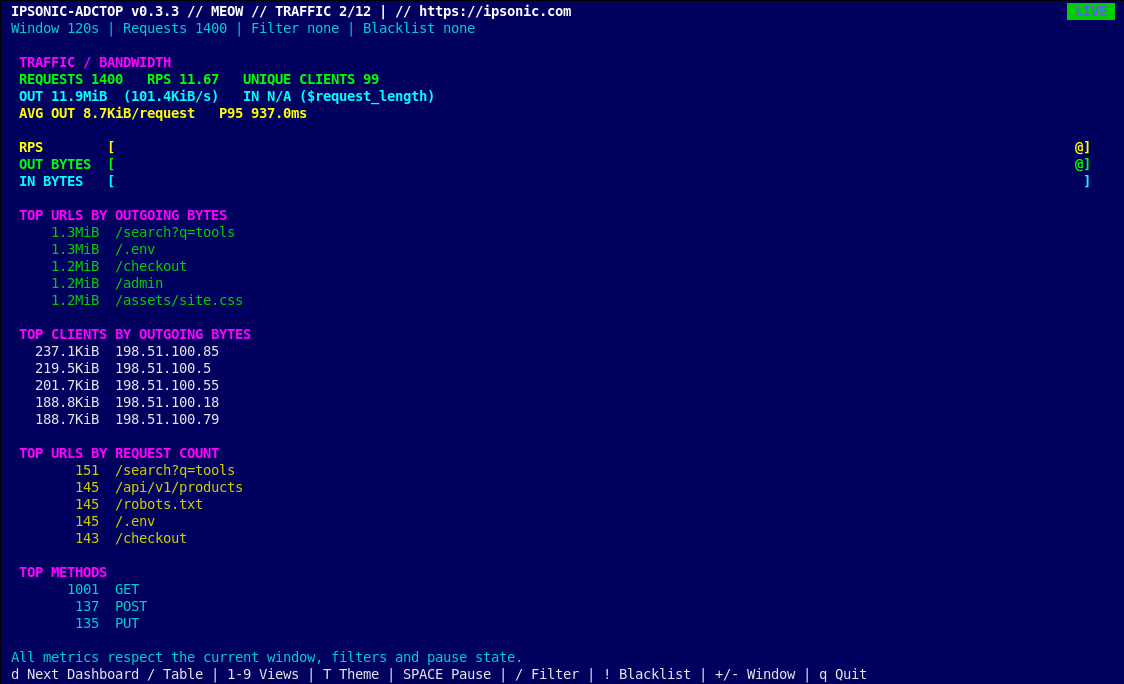
DASHBOARD 02 / 12 · --dashboard traffic

Traffic and bandwidth

See how many requests and bytes move through Nginx. Identify high-volume clients and URLs; use this view to investigate traffic spikes or unexpectedly large responses.

Actual colored curses screenshot of the Traffic and bandwidth dashboard
Actual terminal capture · MEOW theme · synthetic data
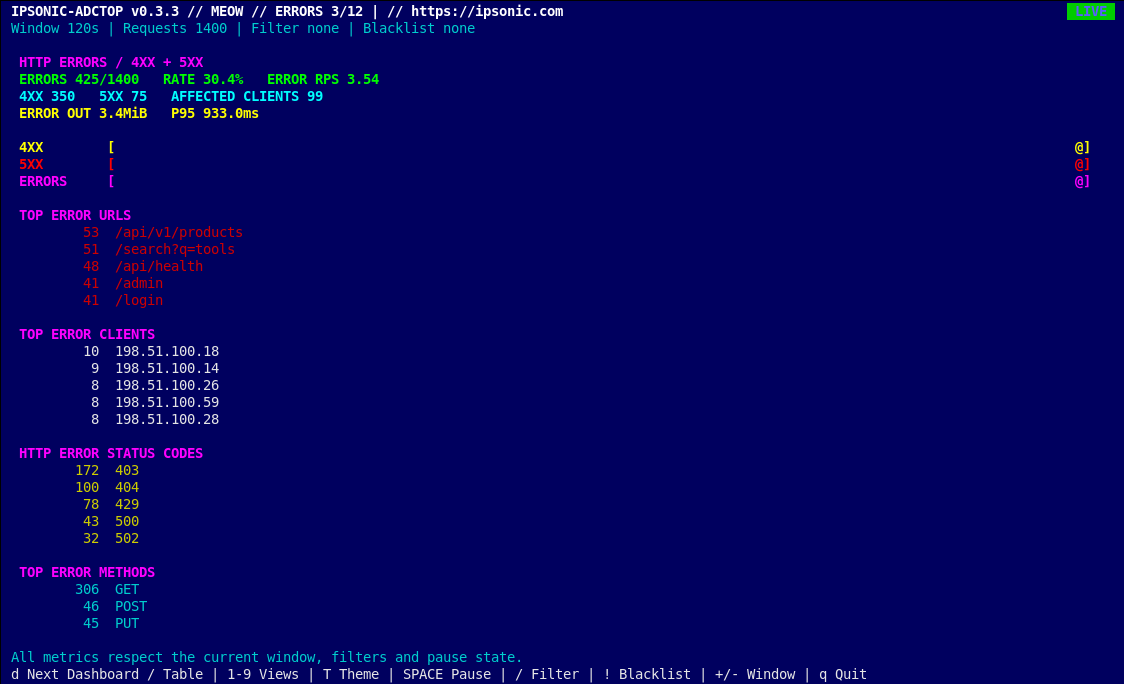
DASHBOARD 03 / 12 · --dashboard errors

HTTP error investigation

Focus on 4xx and 5xx response patterns, top failing URLs, status codes, and affected clients. Useful for separating application failures from rejected or missing requests.

Actual colored curses screenshot of the HTTP error investigation dashboard
Actual terminal capture · MEOW theme · synthetic data
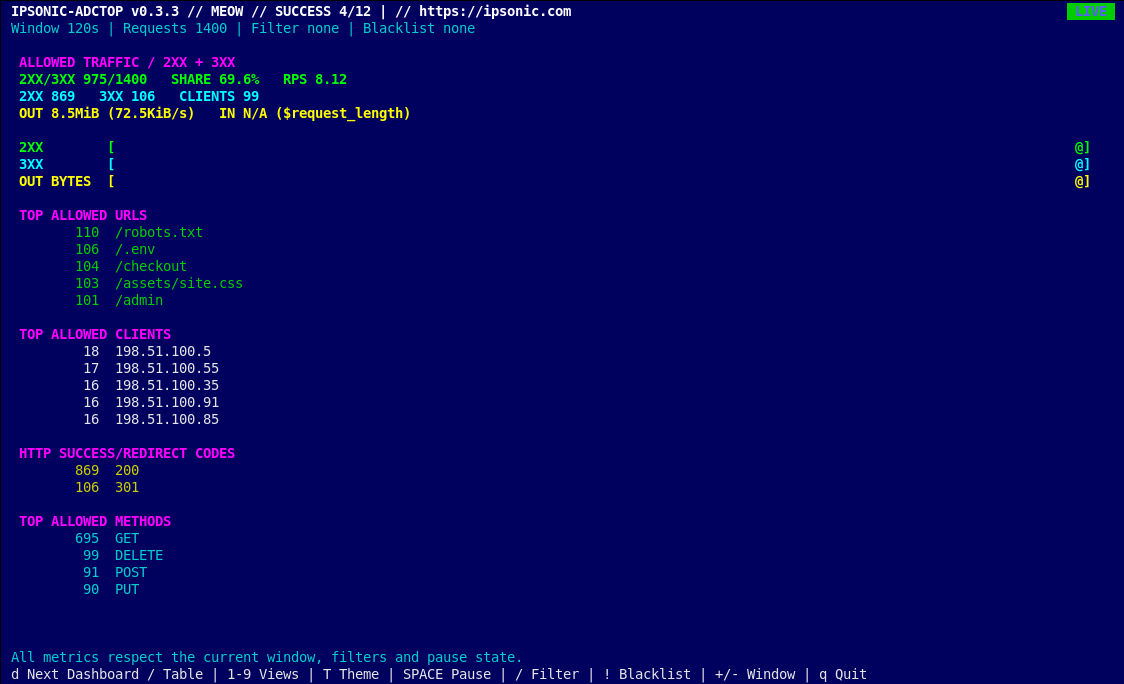
DASHBOARD 04 / 12 · --dashboard success

Successful and redirected requests

Analyze 2xx and 3xx responses separately from failures. Identify the most frequently requested healthy URLs, redirect behavior, methods, and clients.

Actual colored curses screenshot of the Successful and redirected requests dashboard
Actual terminal capture · MEOW theme · synthetic data
DASHBOARD 05 / 12 · --dashboard user-agents

User-agent activity

Rank user-agent strings and inspect the requests and clients associated with them. User-agent values are self-reported and can be forged.

Actual colored curses screenshot of the User-agent activity dashboard
Actual terminal capture · MEOW theme · synthetic data
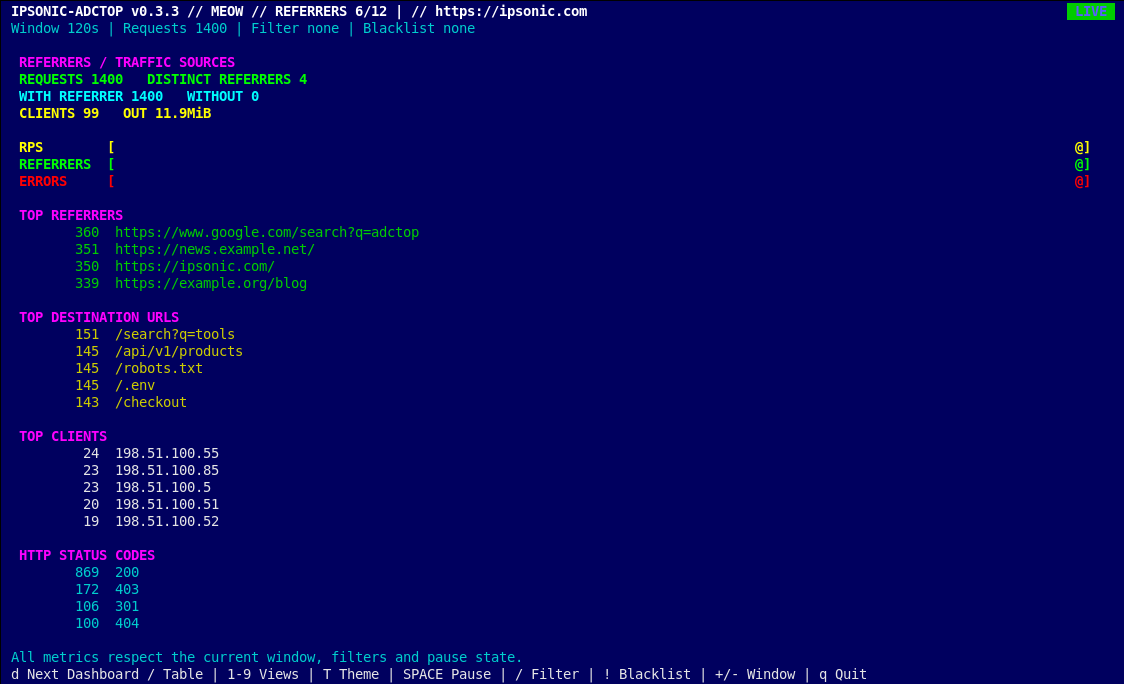
DASHBOARD 06 / 12 · --dashboard referrers

Referrer sources

Inspect referring pages or hosts, the destinations they reach, and their relative request volume. Empty or missing referrers are normal for many clients.

Actual colored curses screenshot of the Referrer sources dashboard
Actual terminal capture · MEOW theme · synthetic data
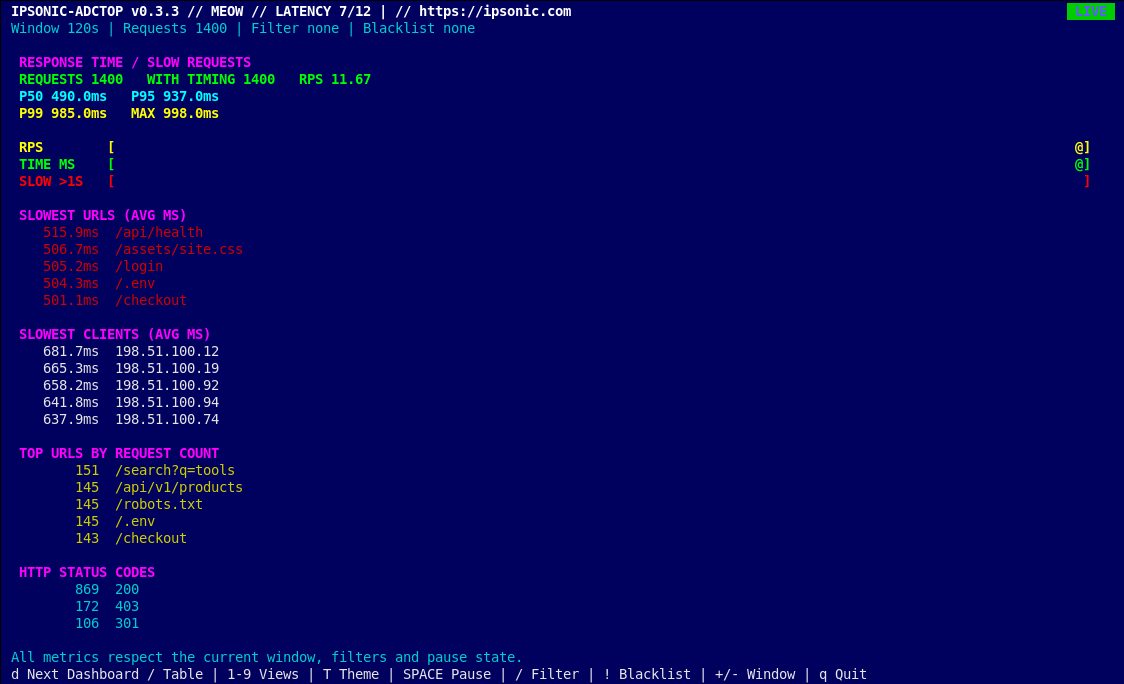
DASHBOARD 07 / 12 · --dashboard latency

Response-time analysis

Review response-time percentiles and slow URLs to identify bottlenecks. Requires request_time values in the access log for meaningful timing statistics.

Actual colored curses screenshot of the Response-time analysis dashboard
Actual terminal capture · MEOW theme · synthetic data
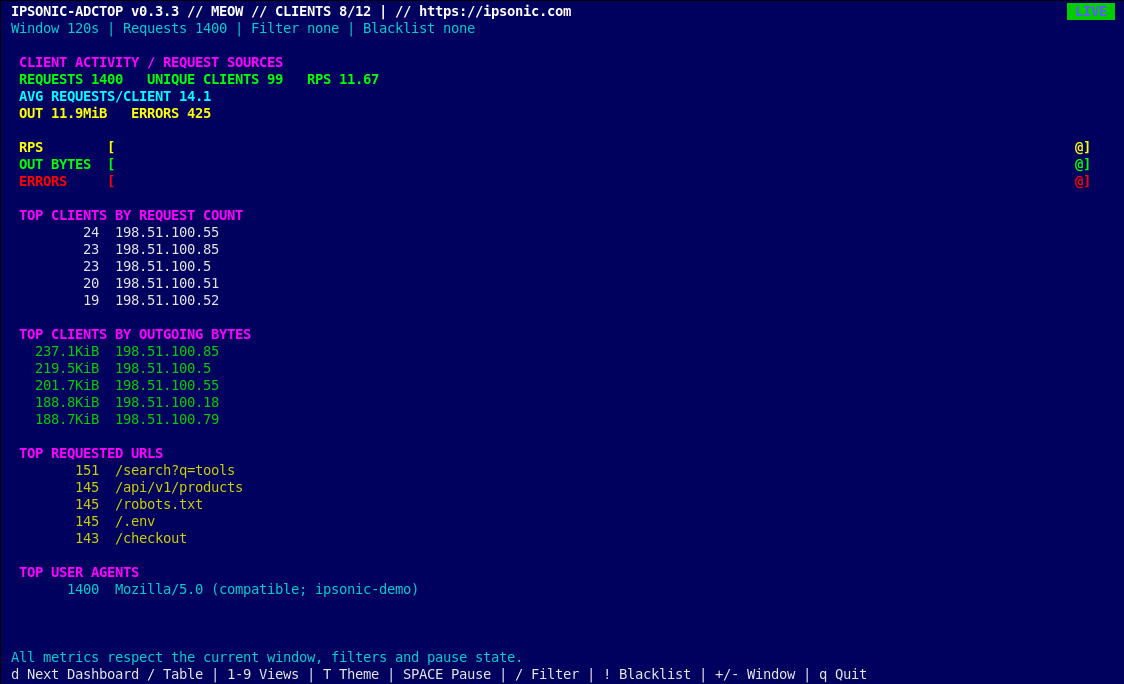
DASHBOARD 08 / 12 · --dashboard clients

Client IP activity

Rank source IP addresses by request count and transferred bytes, then inspect frequently requested paths. IP addresses may represent NAT gateways or proxies.

Actual colored curses screenshot of the Client IP activity dashboard
Actual terminal capture · MEOW theme · synthetic data
DASHBOARD 09 / 12 · --dashboard security

Suspicious request patterns

Surface probe-like paths, denied responses, missing resources, and active clients. These are heuristics for triage, not a determination that a request is malicious.

Actual colored curses screenshot of the Suspicious request patterns dashboard
Actual terminal capture · MEOW theme · synthetic data
DASHBOARD 10 / 12 · --dashboard bots

Bots and crawlers

Show automation-like user-agent patterns, their request volume, target paths, and clients. This is classification by observed log patterns, not verified bot identity.

Actual colored curses screenshot of the Bots and crawlers dashboard
Actual terminal capture · MEOW theme · synthetic data
DASHBOARD 11 / 12 · --dashboard api

API endpoint monitoring

Concentrate on API paths, HTTP methods, errors, and latency. Helpful when Nginx fronts REST APIs or acts as an application delivery controller.

Actual colored curses screenshot of the API endpoint monitoring dashboard
Actual terminal capture · MEOW theme · synthetic data
DASHBOARD 12 / 12 · --dashboard sla

Latency and service quality

Inspect slow-request counts, latency buckets, percentiles, and problematic URLs. This is an operational view, not a contractual SLA calculation.

Actual colored curses screenshot of the Latency and service quality dashboard
Actual terminal capture · MEOW theme · synthetic data

9 detailed table views

Use keys 1–9 to open these tables immediately, or start a table with --page NUMBER. Tables provide focused ranking, sorting, and row selection.

TABLE 01 / 9 · --page 1

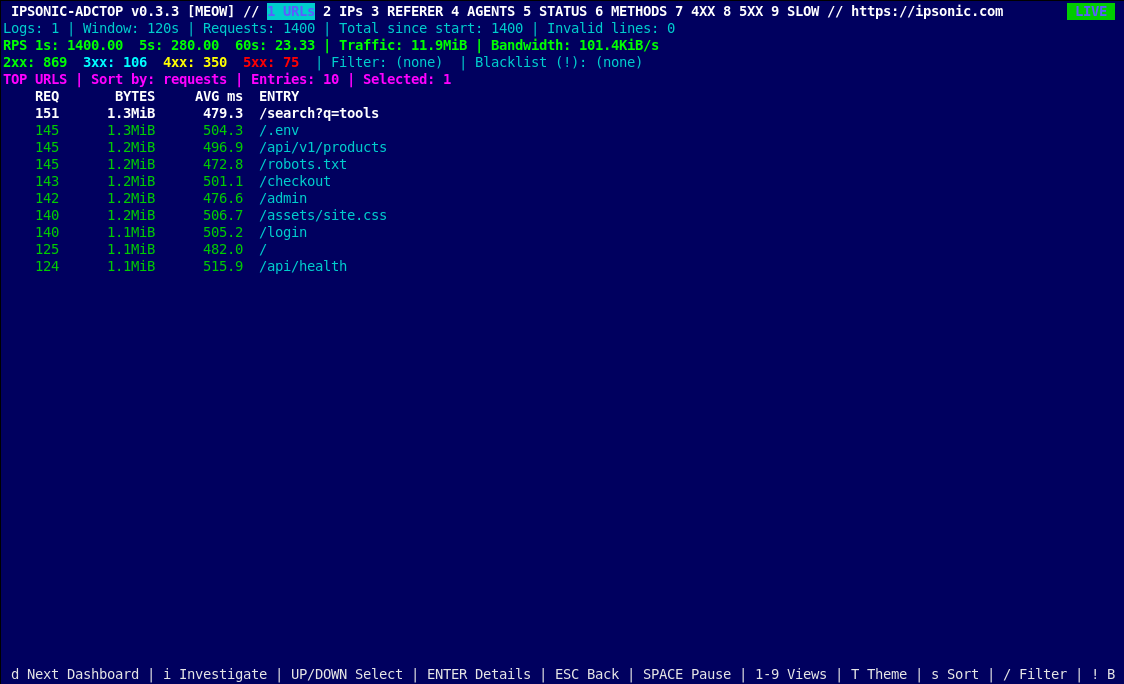
Top URLs

Ranks requested URLs by request count, transferred bytes, and average response time. Useful for finding hotspots and expensive resources.

Actual colored curses screenshot of table 1: Top URLs
Actual terminal capture · MEOW theme · synthetic data
TABLE 02 / 9 · --page 2

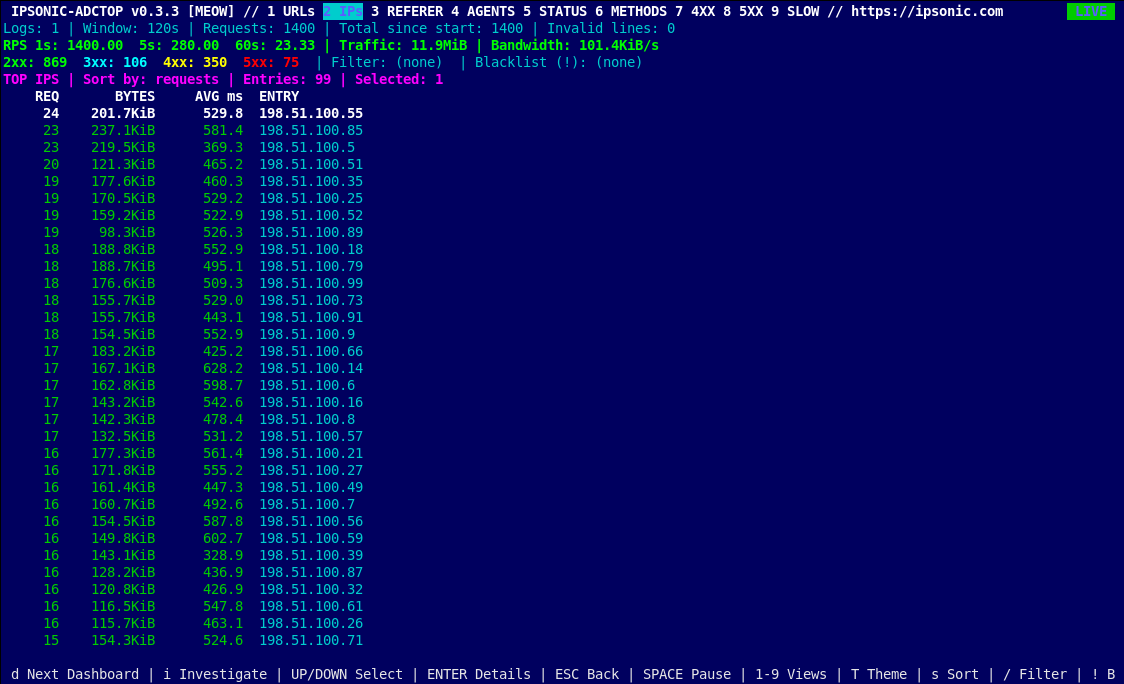
Top IPs

Ranks client IP addresses to expose heavy requesters and bandwidth consumers. IPs may be shared by many users behind a proxy.

Actual colored curses screenshot of table 2: Top IPs
Actual terminal capture · MEOW theme · synthetic data
TABLE 03 / 9 · --page 3

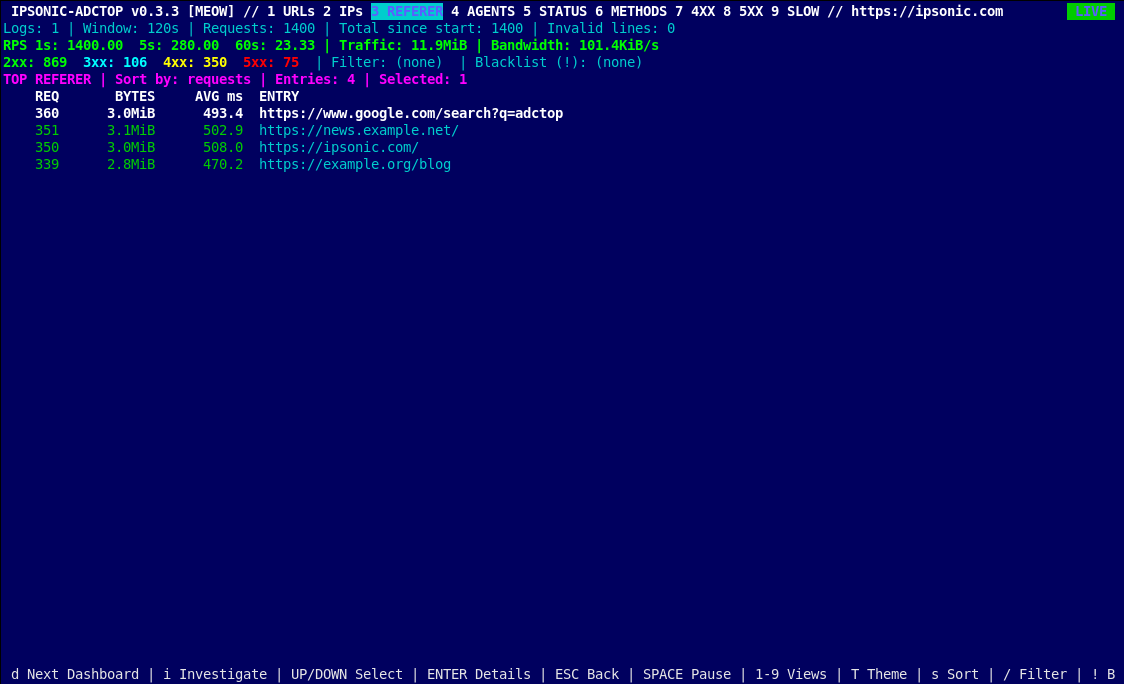
Top Referrers

Lists HTTP Referer values so you can identify traffic sources and unexpected referrer patterns.

Actual colored curses screenshot of table 3: Top Referrers
Actual terminal capture · MEOW theme · synthetic data
TABLE 04 / 9 · --page 4

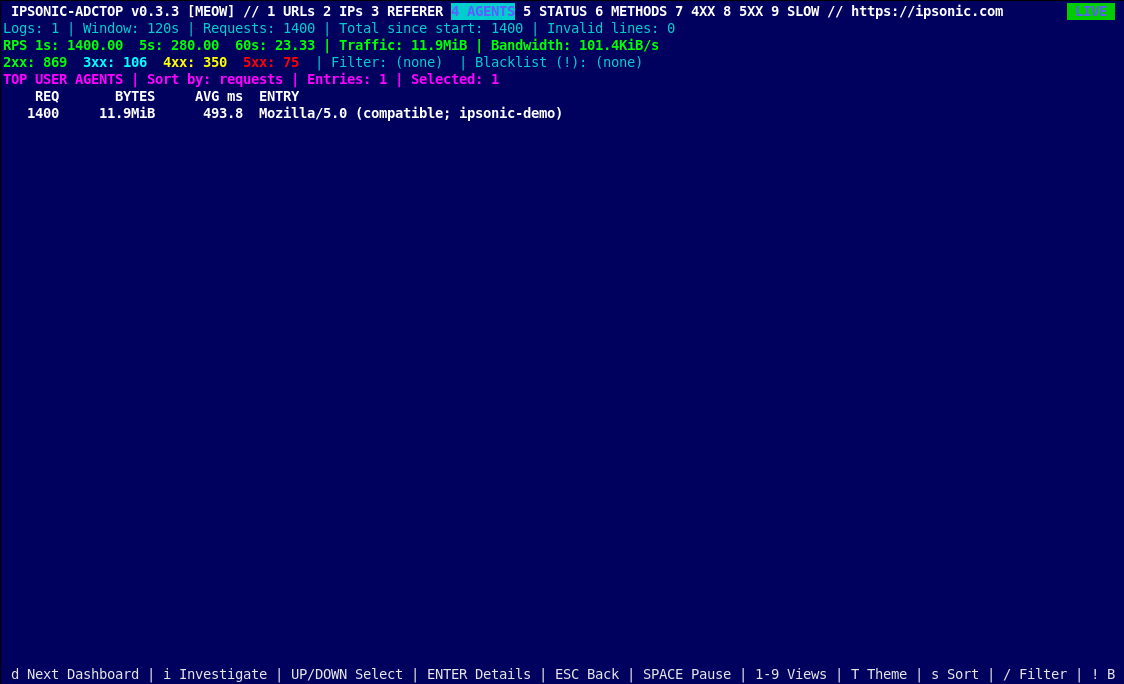
User Agents

Ranks reported User-Agent headers to distinguish common browsers, command-line clients, and crawler-like traffic.

Actual colored curses screenshot of table 4: User Agents
Actual terminal capture · MEOW theme · synthetic data
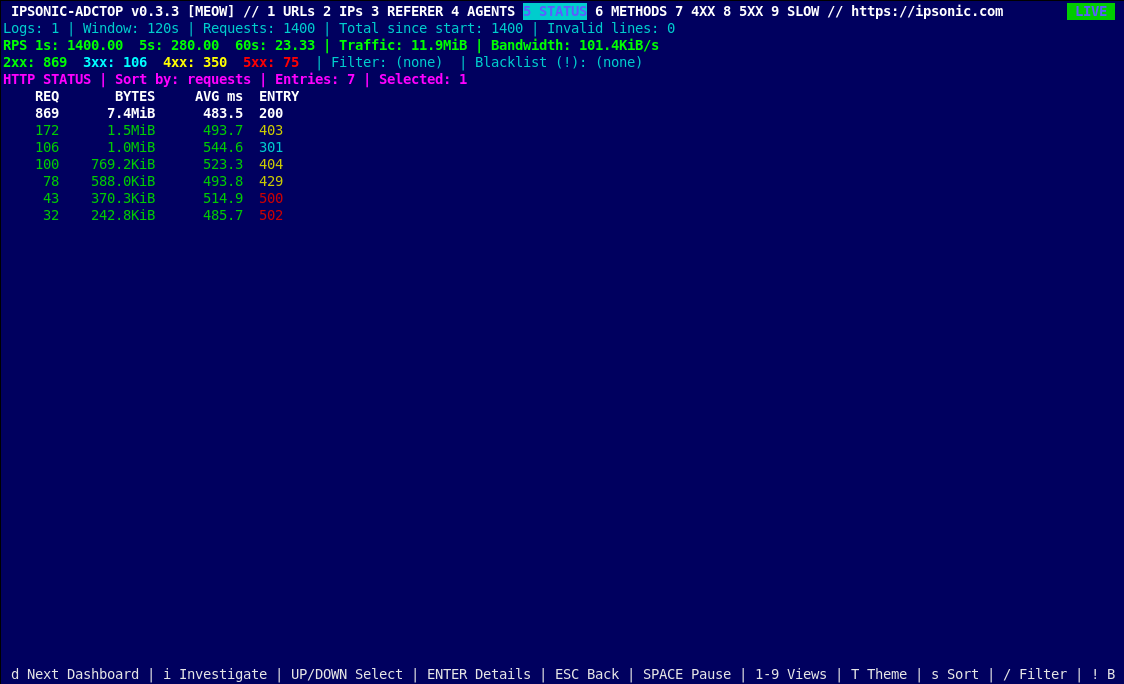
TABLE 05 / 9 · --page 5

HTTP Status

Groups requests by exact HTTP status code, making shifts between successful, redirected, denied, and failed responses visible.

Actual colored curses screenshot of table 5: HTTP Status
Actual terminal capture · MEOW theme · synthetic data
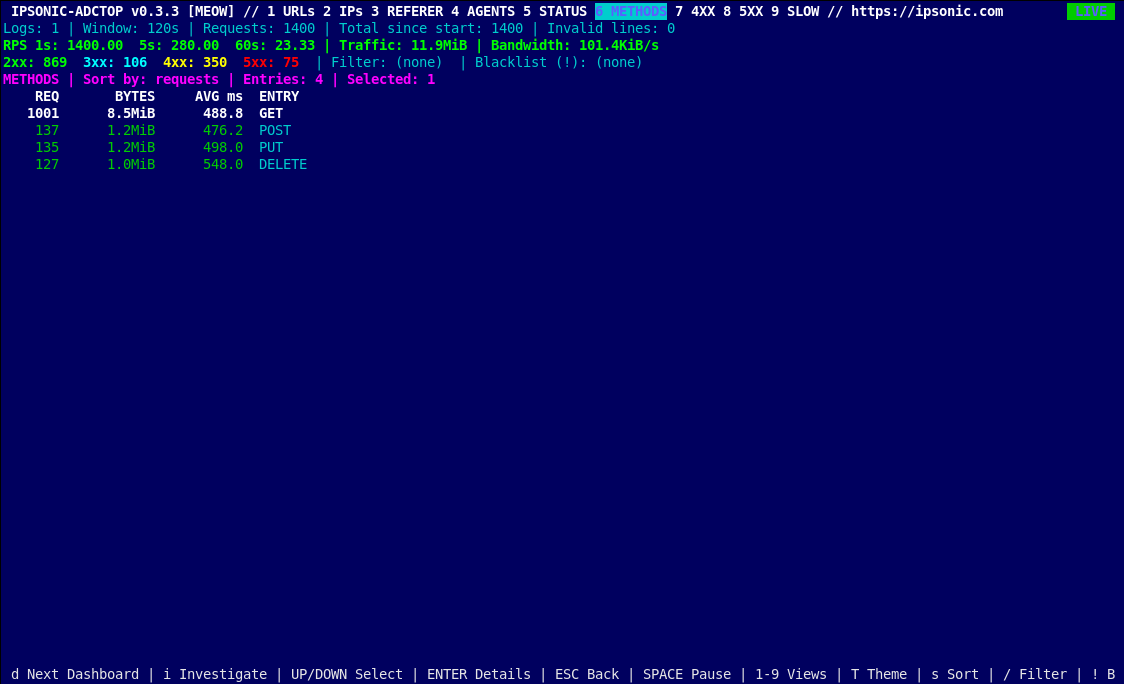
TABLE 06 / 9 · --page 6

HTTP Methods

Breaks down GET, POST, HEAD, PUT, DELETE, and other request methods to understand workload behavior.

Actual colored curses screenshot of table 6: HTTP Methods
Actual terminal capture · MEOW theme · synthetic data
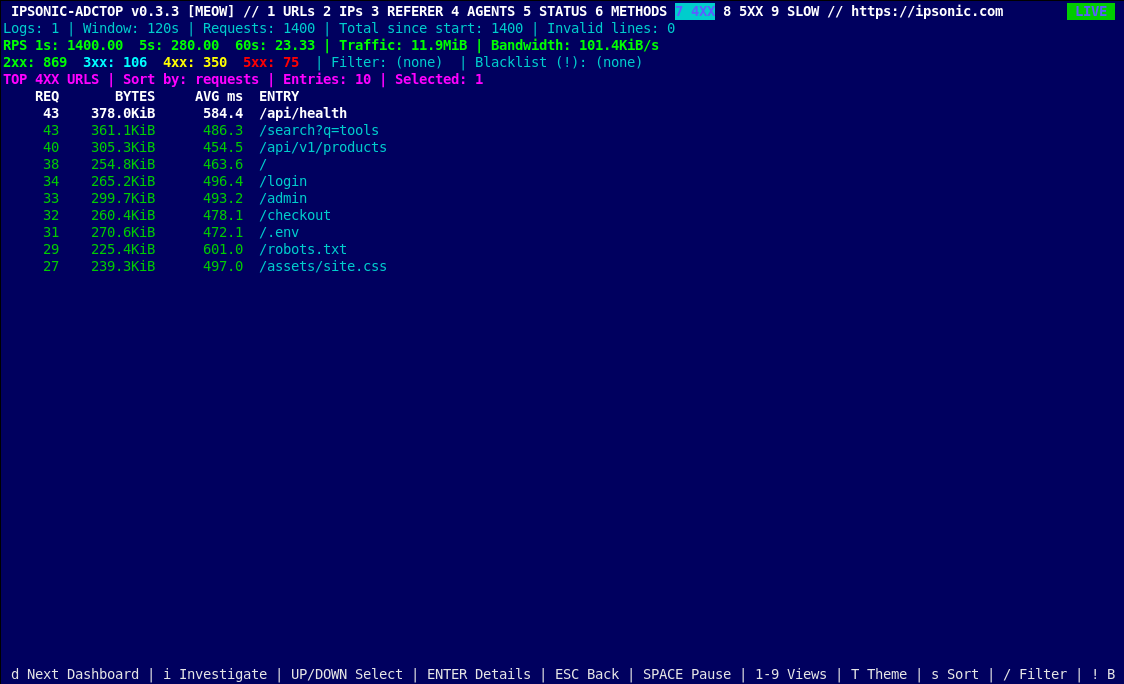
TABLE 07 / 9 · --page 7

HTTP 4xx

Shows the URLs producing client-error responses, including missing paths, access denials, and rate-limit responses.

Actual colored curses screenshot of table 7: HTTP 4xx
Actual terminal capture · MEOW theme · synthetic data
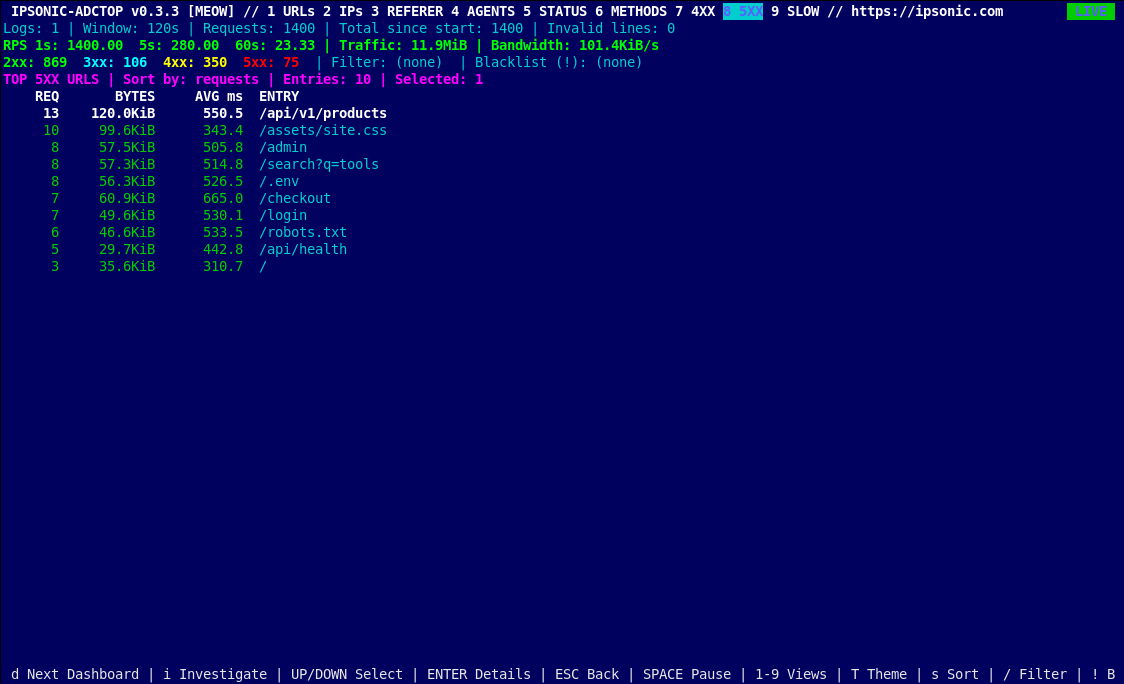
TABLE 08 / 9 · --page 8

HTTP 5xx

Shows URLs associated with server-side errors; use this table to investigate upstream failures and application outages.

Actual colored curses screenshot of table 8: HTTP 5xx
Actual terminal capture · MEOW theme · synthetic data
TABLE 09 / 9 · --page 9

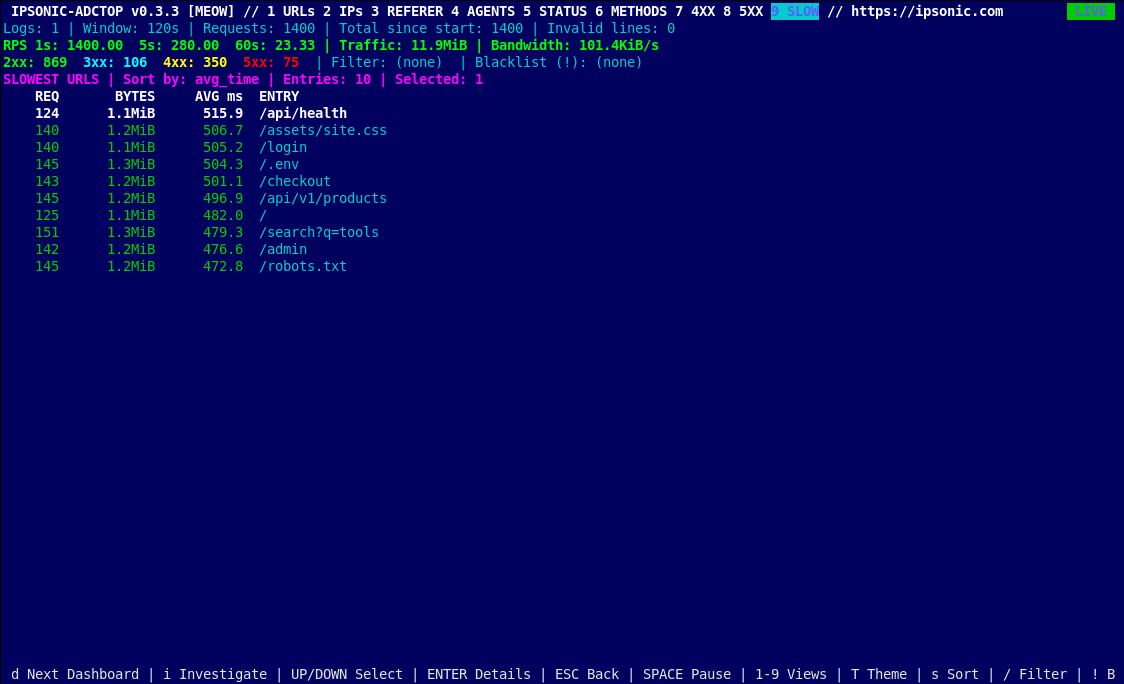
Slowest URLs

Ranks URLs by average request duration where Nginx request_time data is present; helps pinpoint slow endpoints.

Actual colored curses screenshot of table 9: Slowest URLs
Actual terminal capture · MEOW theme · synthetic data
All 21 screenshots are derived from synthetic example logs. They show the real terminal interface, but the figures are demonstration values, not production monitoring data. Latency depends on the optional Nginx request_time field.
03 / Install

One file. One command.

Deploy the Python source as a normal executable. The download is a standalone script — no archive extraction or package manager required.

STEP 1 — DOWNLOAD
Linux / curl
curl -fL https://ipsonic.com/adctop/ipsonic-adctop.py -o ipsonic-adctop.py
STEP 2 — INSTALL SYSTEM-WIDE
Linux / root install
sudo install -o root -g root -m 755 ipsonic-adctop.py /usr/local/bin/ipsonic-adctop
ipsonic-adctop --version
STEP 3 — START MONITORING
Local Nginx log
ipsonic-adctop -d /var/log/nginx/access.log
LOCAL FILES

Files and globs

Read one or more local access logs. Glob patterns let you monitor a group of virtual hosts without adding a log collector.

ipsonic-adctop -d '/var/log/nginx/*access.log'
NO SYSTEM INSTALL

Run directly

For a quick trial, use the interpreter without copying the script into /usr/local/bin.

python3 ipsonic-adctop.py -d access.log
The monitoring user needs read access to the Nginx log. The program does not require root privileges by itself. For latency and inbound-byte metrics, configure Nginx to log request_time=... and request_length=....

Optional Nginx log fields

ADCTOP accepts standard combined access-log records and optional trailing key/value fields. These extra fields improve latency and traffic metrics.

nginx.conf — illustrative log_format
log_format adctop '$remote_addr - $remote_user [$time_local] '
                  '"$request" $status $body_bytes_sent '
                  '"$http_referer" "$http_user_agent" '
                  'request_length=$request_length request_time=$request_time';

access_log /var/log/nginx/access.log adctop;

Nginx's $request_time is in seconds; ADCTOP reports response-time values in milliseconds. $body_bytes_sent represents outgoing response-body bytes, not total wire traffic.

04 / Remote log streaming

Monitor a remote ADC.
Keep your keyboard local.

Run tail -f on the remote host and stream its output into ADCTOP. Use ssh -n so SSH does not compete for local keyboard input.

Step-by-step: read Nginx logs as user@adc

  1. Install ADCTOP locally. Run ipsonic-adctop --help to verify the command is available on the workstation where you want to see the dashboard.
  2. Check SSH access. Run ssh user@adc 'hostname' and confirm you can connect to the Nginx host. For automated access, use SSH keys.
  3. Configure restricted sudo access. Ask the Linux administrator to install the exact-command sudoers rule below. Verify access using sudo -n /usr/bin/tail -f /var/log/nginx/access.log (stop with Ctrl+C).
  4. Start the live security dashboard. Copy the command below into a local interactive terminal. New Nginx requests will appear as they are appended to the remote log.
  5. Operate locally. Use ADCTOP's normal keyboard shortcuts; press q to quit. If log rotation replaces the file, restart the command or explicitly choose different tail behavior.

The command reads logs over SSH without copying log files to disk. The remote host needs SSH, Nginx logs, and tail; the local host needs Python 3 and ADCTOP.

Linux administrator setup: restricted sudoers access

Configure this on the remote Nginx server (adc), not on the workstation. The account user may follow only the specified access log as root, without receiving general-purpose sudo rights.

1 / VERIFY THE TAIL BINARY ON ADC
Run on adc as an administrator
command -v tail
# Expected on many Linux systems: /usr/bin/tail

Use the exact absolute path reported by your server in both the sudoers rule and the remote SSH command.

2 / CREATE A DEDICATED SUDOERS DROP-IN
Run on adc as root or an authorized sudo administrator
sudo visudo -f /etc/sudoers.d/ipsonic-adctop

Insert the following single rule:

/etc/sudoers.d/ipsonic-adctop
user ALL=(root) NOPASSWD: /usr/bin/tail -f /var/log/nginx/access.log

The sudoers entry matches the command and its arguments. It does not permit arbitrary tail options or paths. Do not use wildcards such as /usr/bin/tail * or NOPASSWD: ALL. Use a dedicated account and review log-data access according to your organization's policies.

3 / VALIDATE AND TEST
Run on adc / local workstation
# On adc: verify sudoers syntax and permissions
sudo visudo -cf /etc/sudoers.d/ipsonic-adctop
sudo chmod 0440 /etc/sudoers.d/ipsonic-adctop

# On the workstation: test non-interactive remote access
ssh -n user@adc 'sudo -n /usr/bin/tail -f /var/log/nginx/access.log'
# Press Ctrl+C to stop after log lines appear
Why sudo -n? It prevents a hidden password prompt from blocking the log stream. If the sudoers rule is missing or mismatched, sudo fails immediately. The examples below use the full executable path to match the restricted rule exactly.
Operational considerations: Nginx logs can contain IP addresses, URLs and sensitive query strings. Allow access only to authorized operators. A rule restricted to tail -f still permits ongoing access to that log; treat it as a privileged data-read permission. tail -f follows the current file and may stop showing new requests after log rotation.
RECOMMENDED — REMOTE LOG VIA FD 3
Remote Nginx / reliable terminal controls
ssh -n user@adc \
  'sudo -n /usr/bin/tail -f /var/log/nginx/access.log' \
  | ipsonic-adctop -d security --theme meow \
      --input-fd 3 3<&0 0</dev/tty
Why the redirections matter: ssh -n prevents SSH from consuming local keystrokes. The pipe carries remote access-log lines to ADCTOP. 3<&0 duplicates the pipe onto file descriptor 3, and 0</dev/tty restores local terminal input so dashboard shortcuts work immediately. --input-fd 3 tells ADCTOP to read the log from that separate descriptor.
SSH -N

Prevent input contention

ssh -n detaches SSH's stdin from the local terminal. This avoids competing keyboard readers in the pipeline.

--INPUT-FD 3

Separate the data path

FD 3 carries the remote log stream while standard input is redirected to the local terminal for interaction.

TAIL -f

Follow the open file

tail -f follows the current file descriptor. Unlike tail -F, it does not automatically follow a replaced file after rotation.

Simpler stdin pipeline

Remote Nginx / stdin
ssh -n user@adc \
  'sudo -n /usr/bin/tail -f /var/log/nginx/access.log' \
  | ipsonic-adctop -d traffic

Remote logs with a named dashboard

API latency investigation
ssh -n user@adc \
  'sudo -n /usr/bin/tail -f /var/log/nginx/access.log' \
  | ipsonic-adctop --dashboard sla --theme wallboard \
      --input-fd 3 3<&0 0</dev/tty
If remote sudo requires a password or an interactive TTY, configure appropriate access first. Avoid putting passwords into pipelines. For unattended use, a narrowly scoped sudoers rule for the required log-reading command is preferable to broad root access.
05 / CLI reference

Precise control, zero ceremony.

The options below reflect the included v0.3.4 Python source. Run ipsonic-adctop --help for the built-in help text.

OptionPurposeExample
LOGS...Log paths, glob patterns, or - for stdin/var/log/nginx/access.log
-d [NAME], --dashboard [NAME]Start in a named dashboard; defaults to overview when no name is supplied-d security
-p 1-9, --page 1-9Start in a numbered table view; mutually exclusive with -d-p 9
--list-dashboardsPrint all dashboard names--list-dashboards
--theme NAMEChoose initial color palette; default meow--theme irix
--list-themesPrint the available color palettes--list-themes
--input-fd FDRead log lines from an inherited file descriptor--input-fd 3
-w N, --window NSliding-window duration in seconds; default 60--window 300
-i N, --interval NRefresh interval in seconds; default 0.5--interval 1
--from-startProcess existing log lines at startup using ingestion time--from-start
--top NMaximum rows in each dashboard top list; default 5--top 10
--referer-domainGroup referrers by hostname--referer-domain
--dashboard-referer-exclude REGEXHide matching referrers in dashboard Top Referrers only; repeatable and case-insensitive--dashboard-referer-exclude 'localhost'
-V, --versionShow version and exit--version
-h, --helpShow usage and exit--help

Direct dashboard startup

Examples
ipsonic-adctop --dashboard overview /var/log/nginx/access.log
ipsonic-adctop --dashboard errors /var/log/nginx/access.log
ipsonic-adctop --dashboard security /var/log/nginx/access.log
ipsonic-adctop --dashboard bots /var/log/nginx/access.log
ipsonic-adctop --dashboard user-agents /var/log/nginx/access.log
ipsonic-adctop --dashboard api --window 300 /var/log/nginx/access.log
ipsonic-adctop --dashboard sla --top 10 /var/log/nginx/access.log
ipsonic-adctop --page 9 /var/log/nginx/access.log
06 / Operator controls

Hands on keyboard.

The input reader uses /dev/tty for reliable terminal interaction, even when the log stream arrives via a pipe or a separate file descriptor.

KeyActionKeyAction
dCycle dashboards → table mode → overviewTCycle color themes
1–9Jump to numbered table viewsqQuit
/Set inclusion filter!Set blacklist filter
cClear inclusion filterxClear blacklist
SpacePause / resumerReset collected statistics
+ / -Adjust time windowsCycle table sort mode
↑ / ↓Select entriesPgUp / PgDnScroll lists
EnterDrill into selected URL/client where availableEscReturn from detail view

The nine table views

1 URLs · 2 IPs · 3 Referrers · 4 User Agents · 5 Statuses · 6 Methods · 7 4xx · 8 5xx · 9 Slowest URLs.

07 / Terminal personalities

60 themes. One operator console.

Explore all 60 themes with lightweight HTML color samples (not screenshots). The sample values are illustrative. Press T to rotate themes without restarting.

Explore every palette
ipsonic-adctop --list-themes
ipsonic-adctop -d traffic --theme wallboard /var/log/nginx/access.log
08 / Practical notes

Know what the data means.

Is this a SIEM or a WAF?

No. ADCTOP is an interactive access-log analyzer. Security and bot views are useful operational hints, not definitive detection or prevention.

Does it need a server or cloud?

No. The console reads files or incoming log streams directly. Nothing requires a hosted backend, an account, or external telemetry.

Why are some latency values empty?

Nginx combined logs do not include request time by default. Add the optional request_time field to enable those measurements.

Can I use it across log rotation?

For remote streams, tail -f follows the open file. Reopen or restart the stream after rotation if needed. Use tail -F only when replacement-following behavior is desired.

09 / SECURITY WORKFLOW

From Nginx access logs to Fail2ban filter ideas.

Fail2ban monitors log messages and can temporarily ban addresses when a configured filter and jail detect repeated failures. IPSONIC-ADCTOP complements that workflow: press F to inspect suggested Fail2ban failregex patterns while you investigate live Nginx traffic. No Fail2ban installation is required to view suggestions in ADCTOP.

01 / OBSERVE

Find patterns in traffic

Start in the Security dashboard. Review 401, 403, 404 and 429 responses, frequently requested paths and the clients associated with them. A single HTTP error does not establish abuse.

02 / RECOMMEND

Press F in ADCTOP

Open four read-only regex candidates. Keys 1–4 select a suggestion; Esc or F returns to the monitoring screen. ADCTOP does not create filter files or modify jails.

03 / VERIFY

Test before enforcing

Save and test a candidate against representative access logs using fail2ban-regex. Adjust the expression, exceptions and jail thresholds to avoid banning legitimate visitors.

What the F key recommends

Observed 4xx URL

A candidate matching the most frequent URL with status 401, 403, 404 or 429 in ADCTOP's current event window. The URL path is regex-escaped.

Authentication failures

A generic candidate for Nginx requests returning 401 or 403. A 403 can be normal access control, so do not assume every match warrants a ban.

Missing resources

A candidate for 404 responses. Ordinary broken links and search-engine crawlers can generate many 404s; consider specific paths rather than banning all 404s.

Rate-limit responses

A candidate for 429 responses, useful when Nginx already applies request-rate limits. Verify that the logged address is the real client.

Example: test a candidate with Fail2ban

This is an illustrative starting point for a conventional Nginx combined access log with the client IP at the beginning of the line. It is not a production-ready universal filter.

Example filter: /etc/fail2ban/filter.d/ipsonic-nginx-429.conf
[Definition]
failregex = ^<HOST> - .*?\[[^\]]+\] "[A-Z]+ [^"]+ HTTP/[0-9.]+" 429 
ignoreregex =
Validate against your own log file
sudo fail2ban-regex /var/log/nginx/access.log /etc/fail2ban/filter.d/ipsonic-nginx-429.conf

Inspect the match counts and unmatched examples. Test known legitimate traffic as well as suspicious samples. If you use a custom Nginx log_format, reverse proxy, IPv6 address format, or additional fields, adapt the regex before deployment.

Optional: a Fail2ban jail (administrator-controlled)

Only after validating the filter, a Linux administrator can configure a Fail2ban jail. The following is a configuration example, not an ADCTOP command:

Example: /etc/fail2ban/jail.d/ipsonic-nginx-429.local
[ipsonic-nginx-429]
enabled = false
filter = ipsonic-nginx-429
logpath = /var/log/nginx/access.log
findtime = 10m
maxretry = 10
bantime = 10m

It is deliberately enabled = false. Review allowlists, the server's real client IP handling, firewall backend and operational impact before enabling a jail. Fail2ban is an optional external system; ADCTOP itself still uses only the Python standard library.

Compatibility boundary: ADCTOP v0.3.4 displays suggestions only. It does not load or evaluate existing Fail2ban filter files, calculate real ban decisions, manage jails, or execute firewall commands. The patterns assume a conventional combined-log layout and must be validated with Fail2ban itself.
Privacy and least privilege: Logs can contain personal data, tokens and sensitive query strings. Keep test samples private and limit access to authorized operators. A source IP behind a CDN or reverse proxy may not identify the originating client unless Nginx is configured to log trusted real-client addresses.